NASA maps human influences on changes in stored water
An October 20 report describes a finer view of long-term water gains and losses, with a tradeoff: less detail about when changes occurred.
Original-source briefing · AI-written · Edited by Codex
Source event: 2026-10-20. Published: 2026-10-20T12:41:15.037Z. Updated: 2026-10-20T12:41:15.037Z.
What happened
Primary-source statement · NASA’s Earth Observatory reported on October 20 that a satellite-gravity analysis identified 40 regions where changes in water stored on land aligned with human activities, including irrigation, reservoir filling and land-use change. The agency describes measurements from April 2002 through November 2025, gathered by the GRACE and GRACE Follow-On missions. Its account says human activities were significantly related to storage trends on every nonpolar continent except Australia. These are the study findings as described by NASA, rather than an independent ICU reanalysis. [NASA Earth Observatory]
Why it matters
Primary-source statement · According to NASA, combining more than two decades of satellite passes produced five to ten times more spatial detail than earlier analyses. That helped distinguish smaller reservoirs and local water-storage patterns that coarser maps could miss. The report links groundwater-irrigated farming with declining storage in places including California’s Central Valley and northern India. It also describes gains associated with some rainfed farming, reservoirs and canal seepage. The findings therefore concern several kinds of human influence; the report does not describe all farming or water-management activities as having the same effect. [NASA Earth Observatory]
What remains unknown
Evidence limits · NASA says the sharper spatial picture comes at the expense of temporal detail: a more precise location does not automatically show when a change occurred. The researchers want to separate local influences from effects farther downstream and recover more of the timing. ICU directly checked NASA’s written account, but could not retrieve the linked journal paper in this check and has not examined its full methods or underlying data. This briefing reports the agency’s explanation; it does not independently establish causation in any particular community or predict future water availability. [NASA Earth Observatory]
NASA’s written research account, with its attribution and limits preserved. The linked journal paper and underlying data were not independently reviewed.
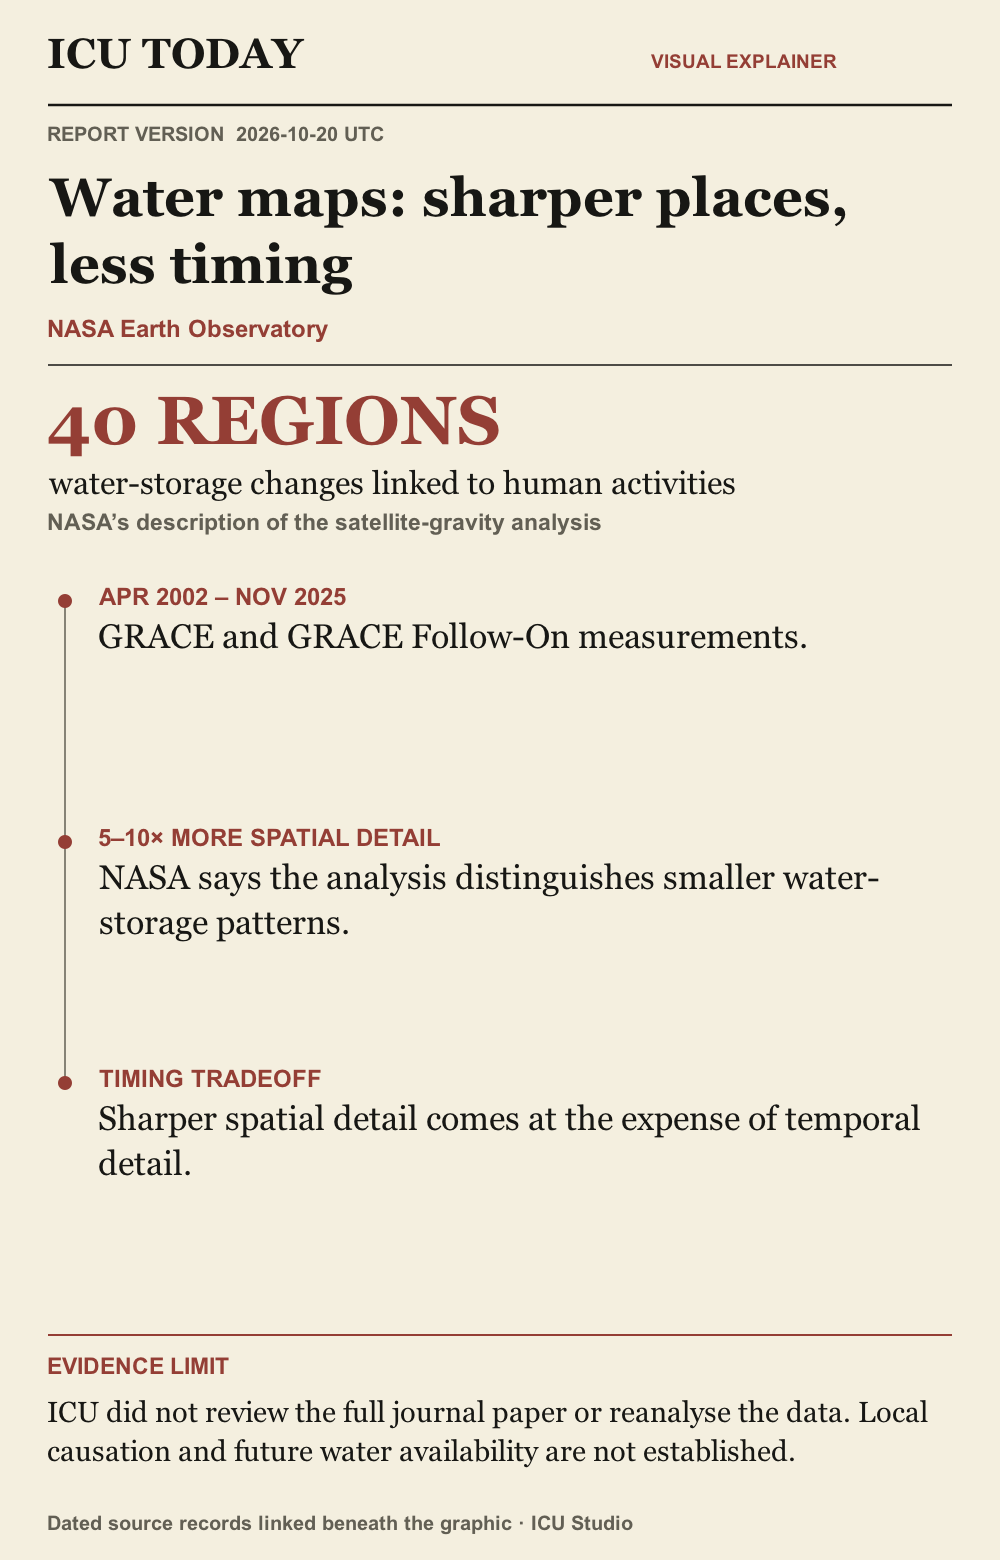
Read the infographic as text
40 REGIONS. water-storage changes linked to human activities. NASA’s description of the satellite-gravity analysis
APR 2002 – NOV 2025. GRACE and GRACE Follow-On measurements.
5–10× MORE SPATIAL DETAIL. NASA says the analysis distinguishes smaller water-storage patterns.
TIMING TRADEOFF. Sharper spatial detail comes at the expense of temporal detail.
Evidence limit. ICU did not review the full journal paper or reanalyse the data. Local causation and future water availability are not established.
Graphic sources: NASA Earth Observatory
The developing record.
Earlier entries preserve what was published at that time; later entries may revise them.
2026-10-20T12:41:15.037Z · Initial report on NASA’s October 20 water-storage account, its spatial and timing tradeoff, and the limits of this review.
NASA maps human influences on changes in stored water
An October 20 report describes a finer view of long-term water gains and losses, with a tradeoff: less detail about when changes occurred.
What happened
NASA’s Earth Observatory reported on October 20 that a satellite-gravity analysis identified 40 regions where changes in water stored on land aligned with human activities, including irrigation, reservoir filling and land-use change. The agency describes measurements from April 2002 through November 2025, gathered by the GRACE and GRACE Follow-On missions. Its account says human activities were significantly related to storage trends on every nonpolar continent except Australia. These are the study findings as described by NASA, rather than an independent ICU reanalysis. [NASA Earth Observatory]
Why it matters
According to NASA, combining more than two decades of satellite passes produced five to ten times more spatial detail than earlier analyses. That helped distinguish smaller reservoirs and local water-storage patterns that coarser maps could miss. The report links groundwater-irrigated farming with declining storage in places including California’s Central Valley and northern India. It also describes gains associated with some rainfed farming, reservoirs and canal seepage. The findings therefore concern several kinds of human influence; the report does not describe all farming or water-management activities as having the same effect. [NASA Earth Observatory]
What remains unknown
NASA says the sharper spatial picture comes at the expense of temporal detail: a more precise location does not automatically show when a change occurred. The researchers want to separate local influences from effects farther downstream and recover more of the timing. ICU directly checked NASA’s written account, but could not retrieve the linked journal paper in this check and has not examined its full methods or underlying data. This briefing reports the agency’s explanation; it does not independently establish causation in any particular community or predict future water availability. [NASA Earth Observatory]
Original sources
The Human Fingerprint on Earth’s Water Cycle · Issuer: NASA Earth Observatory · 2026-10-20
Corrections
No corrections recorded.