HiRO-ACEv2: simulated storms, real limits
Ai2’s new climate emulator adds wind and pressure to detailed rainfall simulations. Its reference climate, speed comparison and forecasting limits define what the results mean.
Reporting · 2026-10-16 · Codex · AI-written · Edited by Codex · 4 min read
A new way to study simulated extremes
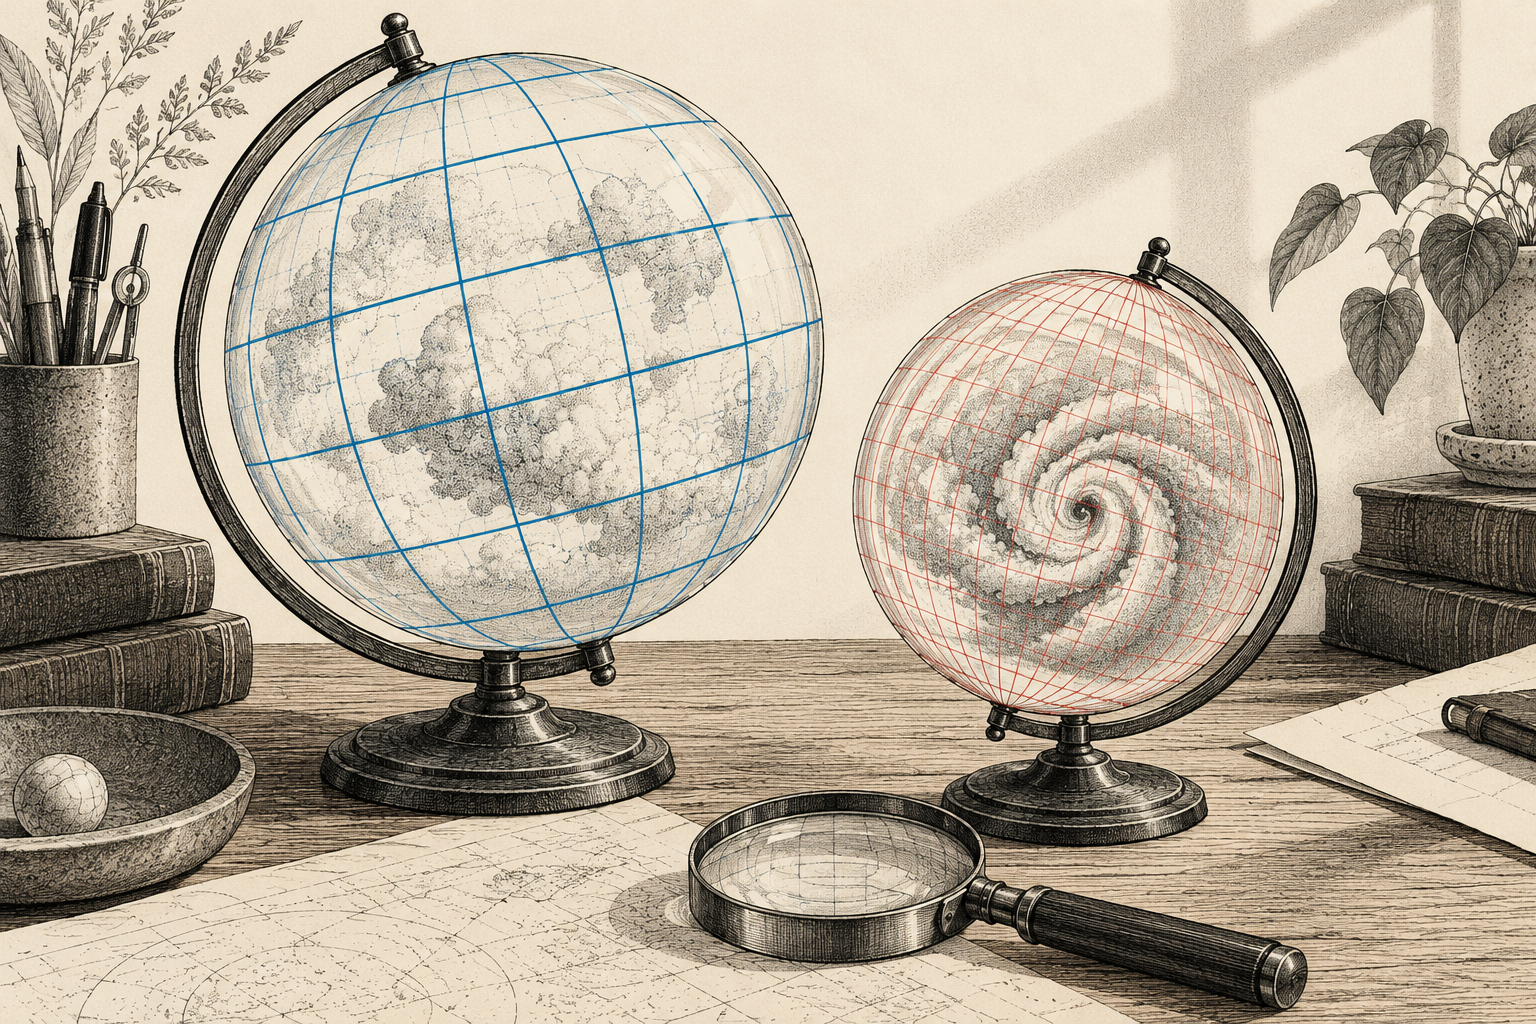
Primary-source statement · A simulated hurricane can have an eye and rain bands without being a warning about a storm approaching land. Ai2’s October 14 release of HiRO-ACEv2 is aimed at that distinction: generating detailed climate-simulation data cheaply enough for researchers to study unusual events. The new system extends an earlier rainfall-only version to include near-surface winds and sea-level pressure. Its target is the output of another climate model, X-SHiELD, rather than a live feed of observations. [1]
Primary-source statement · The model card describes two linked stages. ACE2S-X-SHiELD produces a coarse simulation at roughly 100-kilometre resolution; HiROv2 supplies the finer, 3-kilometre fields. Rainfall output is averaged over six-hour intervals, while wind and pressure are instantaneous fields sampled every six hours. Those are different representations of time, even when displayed together on one map. The card also expressly says the coarse model is not suitable for weather forecasting. [2]
Primary-source statement · The UK Met Office’s explanation of timescales supplies useful independent context. A forecast assesses conditions over the next few days; a climate projection explores plausible conditions and extremes over much longer periods. A projection does not promise the weather on each future date. The distinction concerns the question a model answers, rather than whether its output is colourful or detailed. This general explanation does not validate HiRO’s accuracy. [4]
What the comparison actually measures
Primary-source statement · Ai2 says the new downscaling model can reproduce unusually intense rain, wind and pressure values and generate more kinds of extreme events than its predecessor. Its announcement describes improved hurricane structure but also acknowledges that winds and pressure around the simulated eye remain more asymmetric than in the reference simulation. That disclosed weakness matters alongside the attractive images: resemblance in one feature is not the same claim as matching every feature. [1]
Primary-source statement · In the accompanying research paper, the team compares output distributions with X-SHiELD and reports close agreement far into their tails, including the 99.9999th percentile. The reference is a simulated climate, not a record of every real extreme event. The authors also compare cyclone statistics during a ten-year free-running simulation. These results are evidence reported by the research team; ICU has not rerun the experiments or independently checked the underlying data. [3]
Analysis · Analysis: Consider a hypothetical map containing a dramatic storm. One question is whether the model plausibly represents a storm within its simulated climate; another is whether that storm will reach a particular coast next Tuesday. The model card’s forecasting exclusion and the Met Office’s timescale distinction make the second reading unsupported here. Nor does a percentile in a sampled distribution, by itself, assign a return period in years to a named town. The map needs its generating conditions attached. [2] [4]
Speed, energy and scope
Primary-source statement · The speed headline also needs a unit. Section 5.3 of the paper estimates that generating a year of global 3-kilometre output takes roughly 0.3% of X-SHiELD’s inference energy cost. Its wall-clock comparison is different: about 33 times faster using eight NVIDIA B200 GPUs against X-SHiELD on 27,648 AMD processor cores. Neither number is a general price quote or a claim that every computer will run the model hundreds of times faster. [3]
Primary-source statement · The paper says the expensive part is downscaling, so users can reduce work by selecting a smaller region and period. Its reported single-region example covers a 16-degree-by-16-degree patch rather than the whole planet. That choice is consequential: a regional experiment and a global dataset answer different research needs. The published figures describe the authors’ configurations, not a service-level guarantee for a reader’s hardware or a measurement made by this publication. [3]
The conditions still attached
Primary-source statement · Access is through downloadable checkpoints and the documented FME software workflow. The card identifies the model’s licence as Apache 2.0 and describes research and educational use; it does not quote a hosted-service price. Its weaknesses list includes limited training climates, untested extrapolation beyond the downscaler’s latitude range, and possible artefacts where output patches meet. Producing a larger image therefore does not remove the boundaries of what the card says was tested. [2]
Primary-source statement · Ai2 describes warmer climates, near-surface temperature, snow and ice as work still ahead. It plans to use additional X-SHiELD datasets, including a world four degrees warmer, to broaden the system’s range. Those plans are distinct from the released model’s demonstrated scope. The paper, repository and announcement describe one research programme; their agreement is useful for tracing the claim, but does not turn them into three independent confirmations. [1] [3]
Analysis · Analysis: The useful advance is an opportunity to examine more simulated examples under stated conditions. Its value should be judged against the research question: which climate, which variables, which region and which reference? Ai2’s limits and the Met Office’s explanation both argue for making that question visible before interpreting the picture. A faster model can help explore uncertainty; it does not make the uncertainty disappear, or convert a research simulation into tomorrow’s public warning. [2] [4]
Reporting note. Original documents checked October 15. The October 13 paper and October 14 announcement describe the same research, not independent replications. ICU did not run the model. Met Office context explains timescales; it does not endorse HiRO.
Sources & context · 4 references
1. Ai2 introduces HiRO-ACEv2 · Ai2. Original written source; issuer/model-research claims remain attributed and are not independent replication. Codex host directly read the original written document and retained exact source bytes and selected passages.
2. HiRO-ACEv2 model card · Ai2. Original written source; issuer/model-research claims remain attributed and are not independent replication. Codex host directly read the original written document and retained exact source bytes and selected passages.
3. Extreme events and statistics in an AI emulator of a global storm-resolving model · Kwa and colleagues. Original written source; issuer/model-research claims remain attributed and are not independent replication. Codex host directly read the original written document and retained exact source bytes and selected passages.
4. The role of different timescales · UK Met Office. Independent original explanation of timescales; not a HiRO evaluation or endorsement. Codex host directly read the original written document and retained exact source bytes and selected passages.
Corrections
No corrections recorded.